Connect Events is the registration tool that you can put ‘in front of your webinars and classes. when an attendee registers through the Connect Events tool you can gather a lot more information about their experience. This post covers some of the techniques you might use for webinars and classes.
The overall process for building registrations and running webinars in Connect can be seen in these blog posts:
Connect Events and Seminar Rooms – Overall Process
Connect Events and a Seminar Room…that’s all I need to succeed right?!
How to get up and running with Connect Events licenses in 15 minutes
Registration Questions
The decisions you make prior to your session will of course determine the depth of information you can gather during your session and afterwards. Some considerations for gathering registration information are as follows:
Specificity of Questions
In the actual initial registration form you can capture information prior to the session. Ideally you want to create questions to which you can apply rules in the reporting. For example an open ended question on when you are considering purchasing a solution invites answers that are very subjective and difficult to categorize such as ‘soon’ or ‘in a few weeks’. If the answer field is a pull-down menu with the options ‘within 1 month’, ‘within 6 months’ or ‘longer than 6 months’ you can apply rules in the reporting to track the ‘within 1 month’ attendees differently because you really care about them as leads.
Similarly, if you are running a class, you can use the registration questions to determine if the attendee has completed certain specific pre-requisites that can be used to track a certification in conjunction with other triggers in the session.
Note – later in this blog post we will discuss adding rules to gain more specific ‘categorized’ reporting of qualified leads or certification as described above.
Optional vs. Mandatory Questions
You may have your own opinion on this, but in my view, if you consider a question on the registration to be ‘optional’, why are you even including this in your registration form? Keeping the registration form to the minimum will always improve the registration abandonment statistics. You can track the optional ‘survey’ like questions on your room using polls.
Poll Questions in your Connect Room
Ideally, you want to consider the overall data you wish to collect against an individual and this means that the initial registration questions and the poll questions should be complimentary. For example you may want a poll question that asks again the registration question related to ‘time to purchase’. If the attendee answers ‘within 1 month’ in the registration and still answers ‘within 1 month’ at the end of the demo in a poll then you might want to track these folks separately.
Similarly, if an attendee answered ‘within 1 month’ in the registration form *and* answered ‘I would like to be contacted by an Account Executive’ in the room exit poll you would want to focus on these attendees.
Files Downloaded
You can track what files were downloaded in the room against each attendee. An attendee that downloaded the pricing information or a specific case-study is again giving you a little more information about their degree of interest and their specific focus (enterprise vs. individual data sheets for example).
Ensure that the files you make available for download in your room are well considered and that they both help the attendee make a decision and tell you what the attendee really cares about.
This is information that you would want to pas to an account executive who would be following up with the attendee/prospect.
If you are using this as a part of a certification in a training use-case then you would care if the attendee downloaded the required reading material or an assignment.
Moderated Questions (Q&A)
If you use the Q&A Pod in your Connect room then the questions and the answers (or unanswered questions) will be tracked against the individual. This is again useful information for the account executive who might follow-up with the attendee/prospect.
Attendance Duration
Connect Events will track against the individual attendee the time-in, time-out and the duration the attendee was in the room.
In a sales/lead tracking use-case this tells you a little more about their interest. If they attended for 55 minutes of the 60 minute session then you may want to characterize these attendees differently as they were clearly interested enough to stick around.
In a training use-case you can use the duration in the room for an attendee to determine whether they are considered ‘certified’. Over 55 minutes in the 60 minute class might be considered ‘certified’.
Pre-Session Reporting
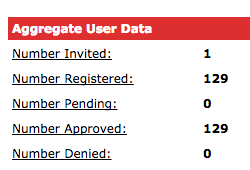
During the lead-up to a webinar or a class, the Event Host can use a few at-a-glance reports to check on the progress of the registration. The most obvious report is the ‘Aggregate User Data’ that will give you a total of the number of registrants (Figure 1). Clicking in the ‘Number Registered’ will let you drill down a little on the specific registrants.
Figure 1
At any time prior to the session you can also download a report of the registration so far from the ‘Report’.”User Information Report’ option and this will give an overview of all quesiotns in the registration form as well.
Useful Hint – Rather than reformatting the report in Excel every time, you can create your own specific reporting format from ‘Event Management>’Event Administration’>’Export Wizard’. the saved format will then be available to select from the ‘Format’ menu.
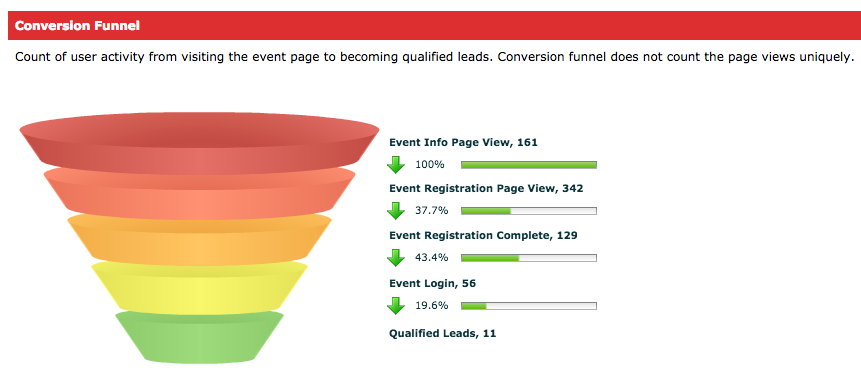
A useful point of data comes from the ‘Conversion Funnel’ at the bottom of the ‘Reports’>’Summary’ section (Figure 2). This telling graphic will give you some idea of the rate of abandonment from potential attendees who (for example) view the registration page but fail to complete it (maybe there are too many quesiotns or the questions are not to their liking).
Note – As mentioned above, we will discuss ‘Qualified Leads’ below.
Figure 2
Categorizing Attendees based on Rules
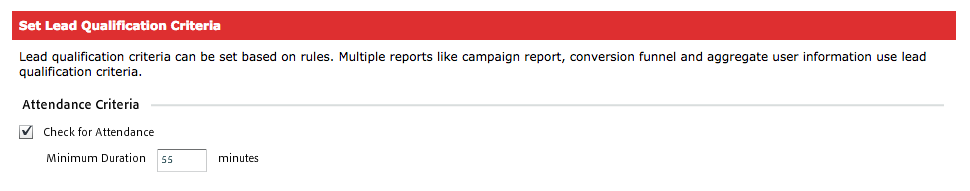
Under ‘Event Management’>(event name)’Reports’>’Registration’ you will find the option ‘Set Lead Qualification Criteria’. You can use this tool to categorize attendees based on how the answer registration questions, polls in your room, and attendance duration.
Attendance Criteria – This section allows you set a rule to classify attendees based on the time they spent in the session, in figure 3 below the rule is set to track those who spent 55 minutes or more in the 60 minute session
Figure 3
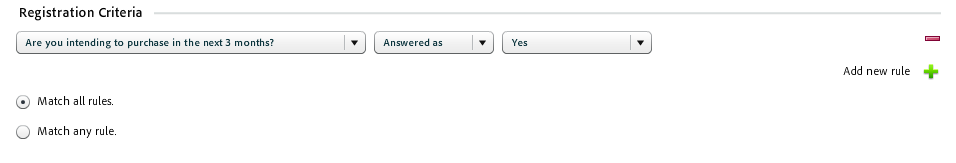
Registration Criteria – Here you can ad one or more rules related to the registration questions (the registration form). You can see in Figure 4 that the questions from your registration form appear in the drop-down menu and you can then chose that the question was ‘Answered as’ for a specific response and then select the response. In the example below from a ‘Yes’/’No’ question type.
The other option is to select that the question was even attempted, but as noted before, that is not typically very helpful data.
If you have multiple questions then you can decide to have all rules or just any of the rules classify the registrant as a ‘qualified lead’.
Figure 4
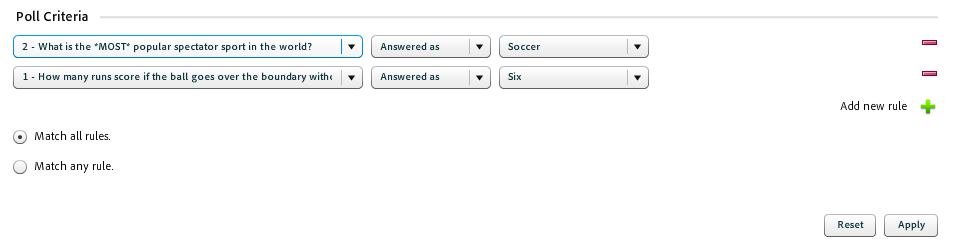
Poll Criteria – This is similar to the registration questions above but in this case the data is being pulled from the polls you have carried out in the Connect room. The example in figure 5 shows that i was able to select the polls from the first drop-down menu and then select ‘answered as’ and select the correct poll answer.
As with registration questions, having a specific poll answer vs. an open-ended or multiple answer poll give a definitive answer that is typically far more valuable in this reporting and classification.
In the example shown in figure 5 I have also based classification on ‘Match all rules’, which means that the attendee must get all of the poll questions correct to be classified as a ‘qualified lead’, or in a more relevant training use-case as a ‘certified attendee’ (as they have passed the quizzes).
Figure 5
Post Session User Information Report
This is the final report that pulls together the information discussed above. We generate the report from the ‘User Information Report’ section as discussed earlier. The report is reasonable large so we will split it up to allow easier viewing of the content here. Note that the report is in fact a single spreadsheet file in reality.
Note – I have redacted the names, emails and phone numbers of the attendees on the report to protect their privacy, this was a live Connect event so the data is legitimate and private.
In figure 6 you can see the name and login of the attendees and then scroll across to see their relevant data:
Registration Date – When they completed the registration form
Attendance Status – Whether or not they attended any part of the session
First Login Time/Last Logout Time – This will determine the duration section of the report
Duration – How long they attended the session and of course in our case this feeds into the next column as the rule set was that they needed to attend for 55 minutes or more to be considered as a ‘Qualified’Certified Lead’.
Qualified Lead – Note that here you will see some attendees who have met the 55 or more minutes attendance criteria, but they are still not considered as a ‘qualified lead’. This is because the rules for answering registration and poll questions were not met in the case of that attendee.
Figure 6

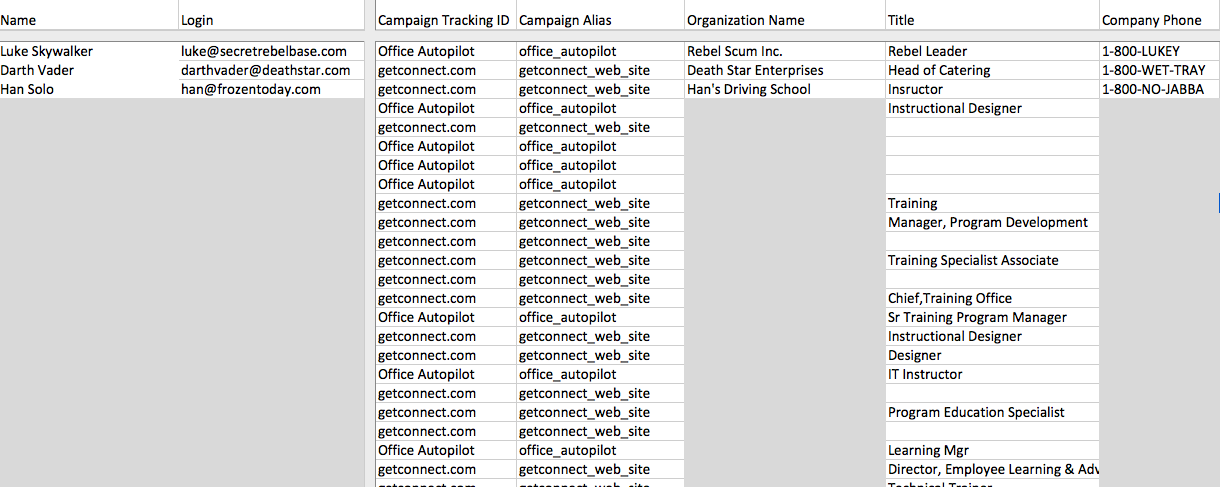
In figure 7 we see the following:
Campaign Tracking ID and Campaign Alias – You can identify the origin of a registrant if you have used campaign alias’ and sent different URLs to register to different sites and social/media options (newsletter, email blast etc.).
Organization Name, Title and Company Phone – These are regular registration question fields and although these are tracked, in my case I did not make these a part of the qualification/certification criteria as they are too open-ended.
Figure 7
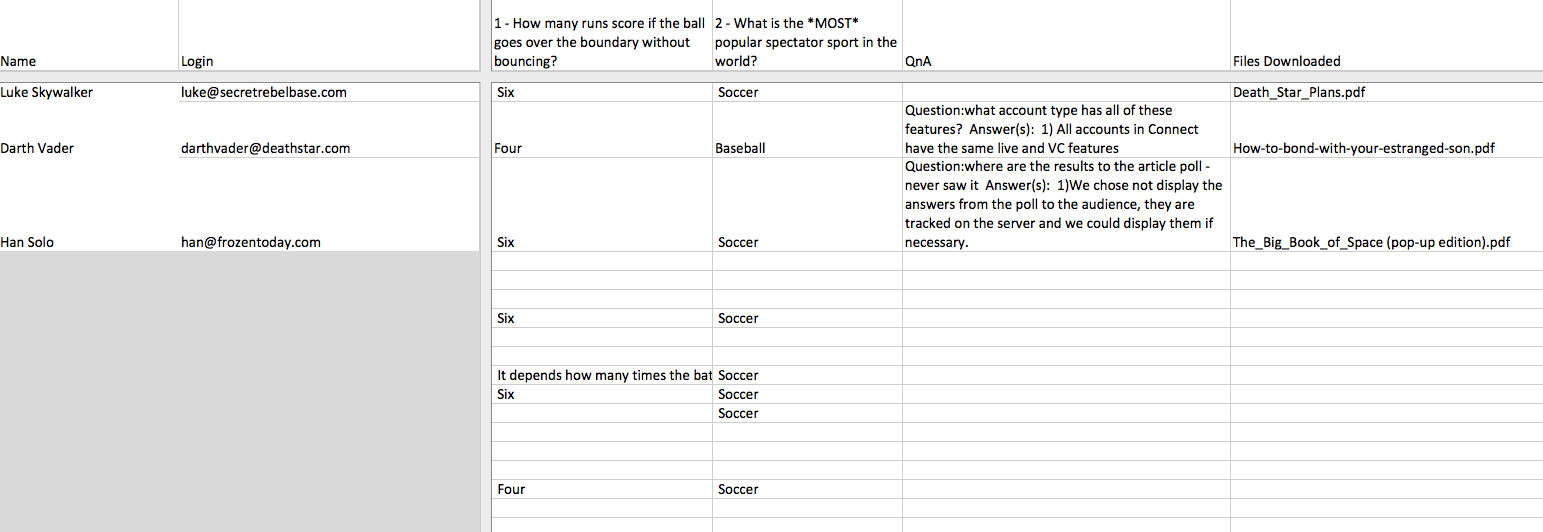
Scrolling over some more, in figure 8 we can see:
Poll Answers – These polls answers are taken from the Connect room and the session in question. Note – Remember to ‘End’ the poll in your Connect room to write the answers to the server for that session.
Q&A Data – The questions from the attendee and the answer (or answers) form the presenters and hosts are tracked here.
Files Downloaded – These are the specific file(s) downloaded by each attendee from the ‘File Share Pod’.
Figure 8
Note – It is important to know that you can change the rules applied above after the event to slice the data in the overall reports in a different way.